Flock profile testing
Flock profile testing gives Merino producers a cost-effective way to benchmark genetic merit and measure the impact of ram purchasing decisions over time.
Understanding flock profile testing
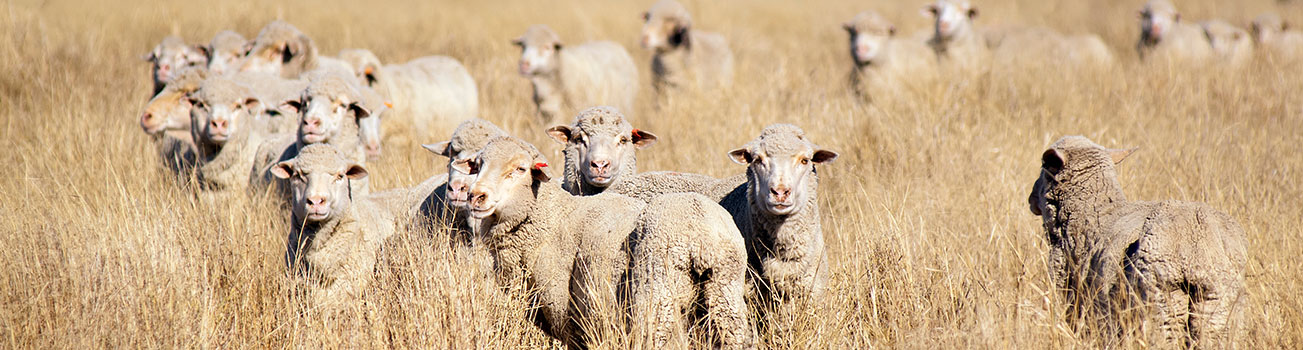
A flock profile test is an analysis conducted by Sheep Genetics Australia that provides a clear snapshot of the genetic merit of your Merino ewe base. Rather than testing every animal individually, flock profiling uses a random sample of 20 animals from a particular age group to benchmark the overall genetic merit of a flock relative to the rest of the Merino industry.
Flock profile tests are available to Merino producers and help identify where a flock currently sits for 13 key production traits and 4 indexes. Understanding the genomic merit of a flock relative to industry standards allows you to assess the impact of your ram purchasing decisions on your enterprise’s breeding objectives.
Because genetic gain is cumulative, small improvements made each year can compound into significant long-term gains. A flock profile provides the baseline necessary to guide ram selection decisions and measure future progress against.
Without this genomic insight, producers must rely solely on visual assessment and won’t have all the information needed to make optimal ram selection decisions.
Using a flock profile test
A flock profile test can also be used to assess variation within a flock over a couple of years. Comparing flock profile test results taken 3 to 4 years apart will help you determine whether ram purchasing criteria are moving the genetic profile of a commercial ewe base in a direction consistent with the breeding objectives of your enterprise.
If you do not want to wait 3 to 4 years, it is also possible to do flock profiles on the oldest and youngest cohort of ewes in your flock and compare the results to see what direction the different traits are heading. It is important to remember, however, that a flock profile test performed on the oldest group of animals can never be truly random, and this should be taken into consideration when comparing results.

Find out where your flock stands
Understanding your flock’s genetic merit puts you in a stronger position to make purchasing decisions that align with your breeding objectives. Get in touch to learn more.

XytoVet flock profile testing
Flock profile analysis is performed by Sheep Genetics Australia regardless of which genotyping company is involved. XytoVet is the only Australian business processing sheep samples through this program, giving producers local support backed by industry-standard analysis.
What XytoVet flock profile testing offers:
- A cost-effective way to understand whole-flock genetic merit
- Insight into 13 key production traits and 4 indexes
- Clear benchmarking to support ram purchasing and breeding strategy
- Concise, easy-to-interpret reports designed for on-farm decision making
- Support from the XytoVet team on sample selection, submission and interpretation
- Partnership with an Australian-owned and operated business
How flock profile testing works
- Producers collect 20 tissue samples from random animals of the same year drop.
- Samples are submitted to the XytoVet laboratory, where DNA sequencing generates genotypes, which are uploaded to Sheep Genetics Australia.
- Sheep Genetics Australia analyses genotypes in relation to the Australian Merino database and produces flock profile test results.
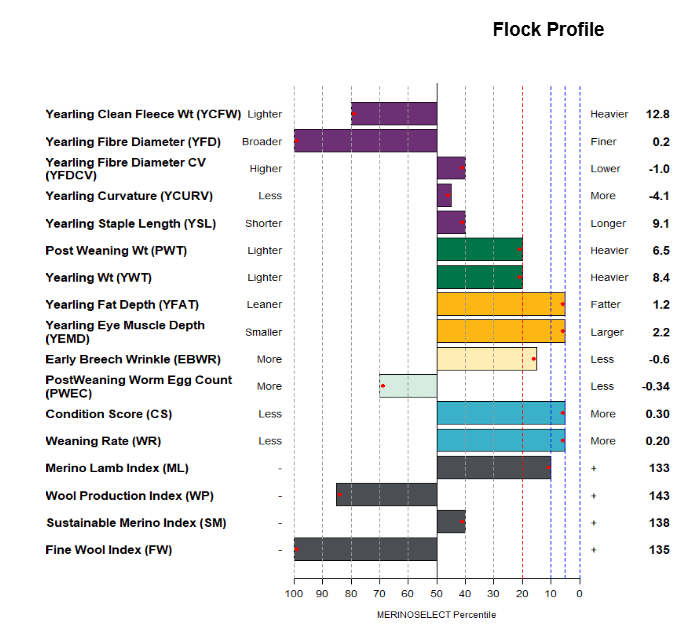
- Results are compiled into a flock-level report (see example below) that provides average breeding values for 13 traits and 4 indexes. Your flock breeding values are compared, using percentile bands, to the average breeding values of MERINOSELECT flocks. So, if you have a score on the 20th percentile for a trait, your flock is in the top 20% of flocks for that trait.
Benefits of Flock Profile Testing
Benchmark flock genetics against industry expectations
Understand how your flock compares with industry benchmarks and identify strengths and opportunities across key production traits.
Make more confident ram selection decisions
Use flock-level genetic insight to guide ram purchases and strengthen long term sire selection decisions.
Support breeding strategy and changing objective
Assess the impact of introducing new ram sources or shifting breeding objectives while maintaining a structured and cost-effective breeding program.
Track genetic progress and prepare for genomic testing
Repeat flock profiling every three to four years to monitor genetic progress and build a foundation for future individual animal genotyping.